Dallas-Fort Worth’s retail market ended 2018 with 92.4 percent occupancy, on par with 92.4 percent at year-end 2017. The occupancy remained stable despite numerous closings from legacy retailers Sears and Toys “R” Us. The stability is mainly a result of strong leasing in existing retail centers and a conservative development climate that has focused on demand-based new retail construction.
The results of the survey show that D-FW is enjoying one of its longest periods of retail real estate stability since Weitzman first surveyed the market in the early 1980s, with this past year representing the fifth consecutive year of D-FW retail occupancy above 90 percent.
During 2018, construction in new and expanded retail centers totaled only 3,501,897 square feet, which is especially low for a market that is a national economic leader in both jobs and population growth. Specifically, the 2018 space deliveries declined when compared to 2017, when 4,225,728 square feet came online.
By keeping new development on pace with demand and adding little if any speculative space, the market has avoided the overbuilding that marked previous periods of strong retail market performance.
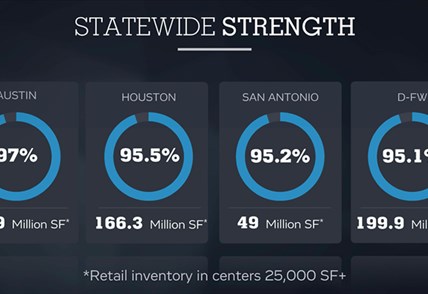
The 2018 Survey & Forecast is based on Weitzman’s review of a total D-FW retail market inventory of approximately 199.3 million square feet of space in projects with 25,000 square feet or more – the largest retail inventory for any metro area in Texas. Weitzman surveys more than 1,400 centers in 42 submarkets, of which 30 submarkets are in the Dallas-area market, and 12 submarkets are in the Fort Worth-area market.
For year-end 2018, the occupancy rate in the Dallas area was 92.2 percent (92.4 percent at year-end 2017). The rate is based on a review of 993 projects with a total market inventory of 137.4 million square feet.
The occupancy rate in the Fort Worth area improved to 92.9 percent, compared to 92.5 percent at year-end 2017. The rate is based on 426 retail projects with a total inventory of 61.9 million square feet.
OCCUPANCY BY CENTER CATEGORY
Community Centers – 94.1 percent (compared to 92.7 percent at year-end 2017) based on an inventory of 74.7 million square feet.
This category, typically anchored by a grocer, is the market’s largest in terms of inventory, which makes its strong occupancy especially important. The market saw large vacancies backfilled, such as a former Target in Carrollton now occupied by WinCo Foods and a former Albertsons in Dallas now occupied by Central Market. The market’s small-shop leasing, plus fully occupied new construction, helped offset the closings by a handful of Tom Thumb and Albertsons locations.
Additionally, community centers continued to see healthy demand for small-shop space from active categories like restaurants, services, fitness, health, beauty and medical tenants designed to serve community needs.
Neighborhood Centers – 90.1 percent (89.0 percent at year-end 2017) based on an inventory of 41.0 million square feet.
Neighborhood centers are typically unanchored centers of 25,000 square feet to 100,000 square feet or more. The category has benefited from demand for restaurant, service and boutique fitness tenants, among others, and in 2018 saw its strongest occupancy in recent memory.
The 90.1 percent occupancy represents the first time in more than two decades that occupancy in the category has reached or exceeded the 90-percent mark.
Power Centers – 93.8 percent (94.3 percent at year-end 2017) based on an inventory of 42.7 million square feet.
The Power category, anchored by big-box category-killer power retailers, reports an overall healthy occupancy rate. However, that occupancy declined in 2018 compared to 2017 due to the failure of Toys “R” Us. Fortunately, two of the closed toy retailer’s boxes have now been re-leased, and a 45,000-square-foot box left vacant by Gander Mountain also was re-tenanted. These backfills, along with the healthy performance of the remaining tenants in the category and a lack of new construction, have created stability for the Power category.
Mixed-use Retail – 94.0 percent (94.5 percent at year-end 2017) based on an inventory of 8.3 million square feet of retail space in projects with other commercial and residential space.
The Mixed-use category, representing mixed-use projects with significant retail space, is one of the more active categories in terms of new construction. Mixed-use projects surveyed by Weitzman feature retail space of 25,000 or more in a configuration with residential, office, hospitality or entertainment uses.
While all of the above shopping center categories reported stability, we did survey a notable rise in vacancy for one category: Malls.
Malls – The mall category, which incorporates 23.8 million square feet in regional and super-regional malls, saw occupancy decline to 87.5 percent, down from 93.3 percent at year-end 2017. The bankruptcy of Sears is largely responsible for the decline in occupancy, as the department store’s closures resulted in vacancy increases in A and B malls, not just at weaker malls. Reduced shopper traffic from anchor closings could lead to increased shop vacancies.
The mall market did report bright spots. The successful redevelopment of a vacant anchor store at the Shops of Willow Bend represents a way forward for the mall category. The redevelopment created an open-air, chef-driven restaurant district, along with experiential retail like The Crayola Experience.
ABSORPTION REMAINS STRONG
The occupancy in D-FW is able to maintain near-record healthy levels due to strong absorption, which is a measure of net leasing. In a nutshell, absorption measures net leasing demand by using a formula to determine the net change in occupancy for existing plus new space.
For 2018, the market reported 2,813,414 square feet of net leasing (absorption). Though the total is a slight decline over the 3.2 million square feet absorbed in 2017, it still represents one of D-FW’s stronger leasing periods over the past two decades.
A total of 1,341,248 square feet of space was absorbed in the Dallas area, and in the smaller Fort Worth-area retail market, a strong 1,472,166 square feet of space was absorbed.
IN A LOW CONSTRUCTION MARKET, DEVELOPERS TURN TO REDEVELOPMENTS
With the continued growth in established neighborhoods, developers increasingly have turned to redevelopments to create modern shopping environments that will attract expanding tenants.
One notable redevelopment in 2018 involved Victory Park, a major mixed-use development that created a new retail environment for a number of restaurants and a new entertainment anchor, luxury cinema Cinépolis.
Other anchors expanding in existing space include WinCo Foods, which in January 2018 opened a new 85,000-square-foot store at the site of a closed Target at Trinity Valley Shopping Center in Carrollton. Adjacent to Trinity Valley, the 1970s-era center Trinity Plaza was completely redeveloped in 2018.
The improved health and occupancy of existing centers is a major reason that the D-FW market continues to report its highest occupancy rates in years.


